14 Ways to visualize your lessons with Visme
 Lucie Renard —
With today’s information overload, it’s necessary to keep your students engaged and focussed. And that’s a hard task when you’re dealing with all different students with different interests.
To top things off, your students’ average attention span has shrunk from 12 seconds in 2000 to 8 seconds in 2013. That’s one second less than that of a goldfish! Even more impressive is that people switch between digital devices 21 times per hour.
So, as a teacher, we’re trying to get our students’ attention as long as possible. You can do this with microlearning and differentiation, but there’s another way as well… Visualize your lessons.
That’s where Visme comes in. An image creation tool that lets you create a colored classroom.
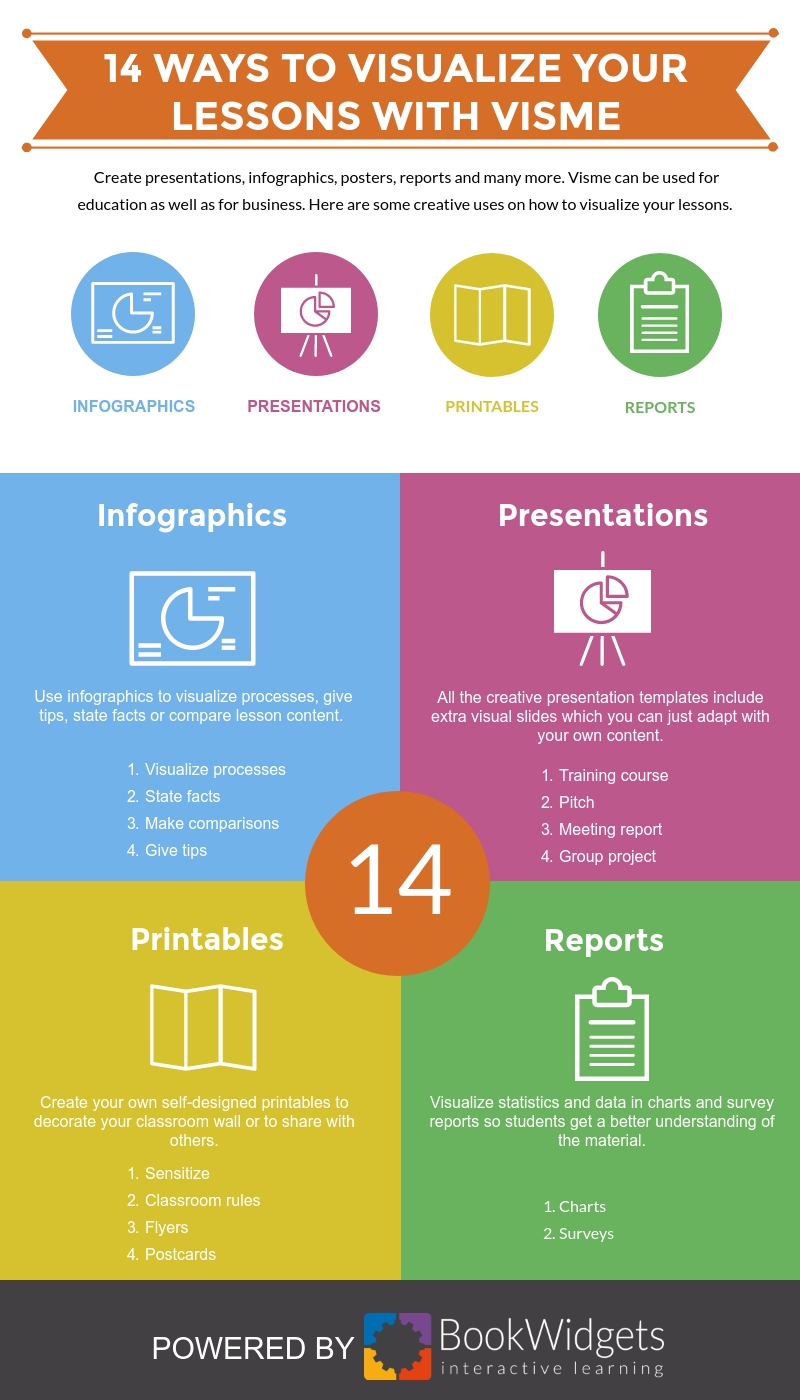
Create presentations, infographics, posters, reports and much more. Visme can be used for education as well as for business. In this post, I’ll give you some inspiration on how you could use Visme in your classroom to spice things up!
Color your classroom with these 14 visual lesson ideas
Infographics
Use infographics to visualize processes, give tips, state facts or compare lesson content. Here are some fun ideas!
1. Visualize processes
 A lot of learning subjects include processes to follow or steps to be taken. How are your students going to remember all those steps? Visualize the process with an infographic. Add images or icons to the infographic to make it easier for students to remember the steps in the process.
2. State Facts
 You probably know that mind maps are used for students to memorize better. Instead of using mind maps, you can also create an infographic that states facts about your lesson topic. Interesting numbers, definitions, fun facts, know-how’s, etc. Add icons, images and powerful colors to make it more appealing for students to learn.
3. Make comparisons
 What’s the difference between reptiles and amphibians? Or between a rainforest and a tropical forest? What’s the difference between different cultures? Or between a gothic and romanesque architecture? Compare two opposites or subjects with each other in an infographic. This way students get a better understanding of the differences between learning topics.
Rather want to make a digital comparison? Then, you should definitely choose the “Spot the difference widget” from BookWidgets. Let your students spot the differences between two images.
4. Give tips
 It’s easier to give tips that are visually appealing that just write them down on a paper. Every tip goes with an image. That’s the way students are going to remember your tips. It’s proven that combining text with images is easier to remember than just text or just images. So, pour those tips into a nice infographic!
Presentations
Using images in your classroom (or better, in your presentations) is always a good idea. Visme has a lot of creative presentation templates, ready to be filled with your content. All the templates include extra visual slides which you can just adapt with your own content.
5. Training course
 Use the template “training course” to create a lesson or a course. You’ll like the structure it provides to you, and eventually, to your students. This lesson template is filled with nice matrixes, key takeaways and other visual slides.
6. Pitch
 Introducing a lesson topic? Why not try pitching it? How can you get your students’ interest in just a few minutes? I’m sure it will help you catch your students’ attention more often in the future when you know how to pitch. Use Visme’s pitch template to get started. And of course, your students can use this template as well to pitch their own idea or project.
7. Meeting report
 There comes a point when students have to learn about meetings. They’ll have to take a meeting and write a report about it. Visme’s “Meeting report” template helps you to structure your presentation and your own meeting report example. This way students learn how to write a clean report about the meeting they had to plan.
8. Group project
 To top things off, use the “group project” presentation template. As we all know, group projects come around very often in education, no matter what course you teach. Give your students the right template for their project so they can built a well structured presentation.
Printables
Create self-designed printables or posters to decorate your classroom wall or to share with others. Create sensibilisation campaign posters, school event flyers, best wishes postcards and classroom rules posters.
9. Sensitize
 Hang some self-designed posters on your classroom wall. Content? Well, try to sensitize your students about certain subjects like cancer, global warming, smoking, stds, poverty, and so on. Images tell much more than only words.
How about letting them create a poster like this? How would your students sensitize the people of their own age?
10. Classroom rules
 In elementary school, students often find it hard to follow your classroom rules. Make those rules visual by creating a poster and hang it in your classroom, somewhere the complete classroom can see it. Now, students don’t have any excuses to forget them anymore.
11. Flyers
 The school has some fun events of its own. Dinner days, fundraising activities, parent meetings and so on. Use Visme to create some nice flyers for these school events. Create them yourself or let your student use their creativity.
12. Postcards
 Whether a student is sick, or the holidays are coming up, we are all in the mood for some good wishes. Let your students create a “get well” postcard, or a postcard with some “Happy Birthday” or “New Year” wishes. Choose a fun design, and they’re good to go. What a fun way to create a classroom that’s tied together.
Reports
Visualize statistics and data in charts and survey reports so students get a better understanding of the material.
13. Charts
 Showing important statistics, numbers and figures is always better when thrown in a nice chart. It’s easier for your students to understand as well, and it’s easier for them to analyse data that’s visually appealing and structured.
You can also ask your students to create charts on their own. Let them read a text and visualize important facts and figures in the charts. That way, you know if students really understood the text and you’re teaching them some analyzing skills.
14. Surveys
 Surveys are the key to data. And of course, visualizing that data is possible with Visme’s “survey” templates. Take a survey from your students or teacher colleagues with the BookWidgets Survey widget and pour the results in a nice Visme survey template. Just fill out some numbers, and Visme’s templates will adapt the visual immediately. Talk about an easy way to create strong and meaningful visuals!
Wrap up
That’s it! Using images in your lessons will definitely trigger your students’ interest. Of course, you can create many more appealing images with Visme (or other content creation tools) for specific courses. I just gave you some starting ideas. What way will you spice up your lessons?